From One Cell to a Living Map: How Single-Cell Genomics Is Changing Biology
CISRED explores how single-cell genomics, transcriptomics, spatial biology, and computational analysis reveal cellular diversity and biological organization.
From One Cell
to a Living Map
How single-cell genomics, transcriptomics, spatial biology, and computational analysis are changing the way scientists understand biological systems.
What if a tissue is not one biological system, but thousands of different stories?
Traditional biological measurements often describe an average signal across many cells. But cells inside the same tissue can have very different identities, transcriptional programs, developmental states, and responses to their environment.
Single-cell genomics changes the question. Instead of asking what happens to a tissue as a whole, scientists can begin asking what individual cells are doing, which cells are related, where they are located, and how their states change over time.
Biology is not average.
A tissue may contain multiple cell types, transitional states, rare populations, and cells responding differently to the same environment.
Bulk measurement
Thousands or millions of cells contribute to one combined molecular signal.
Single-cell measurement
Molecular information is associated with individual cells, allowing hidden cellular populations to be separated computationally.
What happens when we separate individual cells?
The first conceptual step is simple: instead of treating a tissue as one measurement, scientists preserve the identity of individual cells before molecular profiling.
In single-cell RNA sequencing, individual cells or cellular compartments are isolated and their RNA molecules are converted into measurable molecular information. The result is a high-dimensional dataset in which each cell becomes a biological observation.
From RNA molecules to cellular identity.
Gene expression provides a molecular fingerprint. Different cellular states produce different combinations of expressed genes, allowing computational methods to distinguish biological populations.
Capture
RNA molecules are associated with individual cells or cellular partitions.
Sequence
Molecular information is converted into sequencing data.
Quantify
Computational pipelines estimate gene expression across individual cells.
Interpret
Expression patterns are connected to cellular identities and biological states.
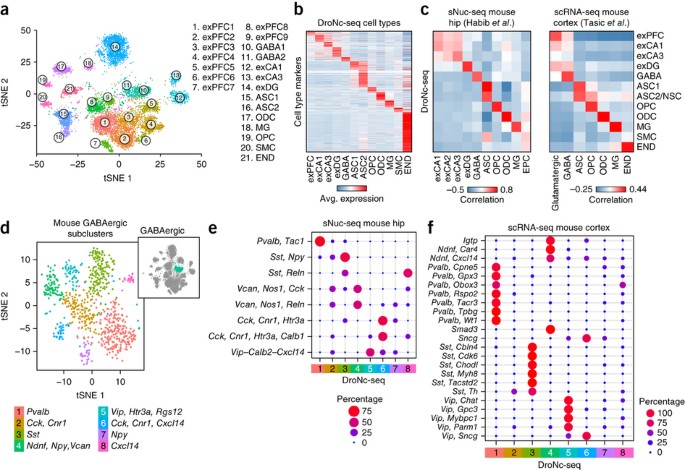
A tissue is a community, not a single cell type.
Once thousands of cellular profiles are available, computational analysis can reveal populations that were previously hidden inside an averaged tissue measurement.
Immune cells
Distinct immune populations can occupy different functional states and respond differently to their environment.
Epithelial cells
Cellular programs can reflect differentiation, tissue organization, and specialized functions.
Stromal cells
Supporting populations can influence signaling, structure, and interactions between neighboring cells.
Rare populations
Small cellular groups may become visible when their molecular profiles are measured individually.
Activated states
Cells of the same broad identity can occupy different transcriptional states.
Transitional states
Cells may occupy intermediate molecular states during differentiation or biological change.
How do scientists know which cells are different?
Single-cell datasets contain thousands of measurements for thousands of cells. Computational analysis transforms this complexity into interpretable cellular maps.
Quality Control
Low-quality or technically problematic observations can be identified before downstream analysis.
Dimension Reduction
Complex gene-expression information can be projected into lower-dimensional representations.
Clustering
Cells with similar molecular profiles can form computationally defined groups.
Biological Annotation
Molecular markers and biological knowledge help connect computational clusters to cell identities.
The cell map becomes visible.
Methods such as UMAP can represent relationships between cells in a two-dimensional space. Nearby cells generally have more similar molecular profiles than distant cells.

What happens when location matters?
A cellular map becomes even more informative when molecular measurements retain their position inside a tissue.
Not only what a cell expresses. Where it exists.
Spatial transcriptomics connects gene-expression information with tissue architecture.
This creates a bridge between molecular identity and physical organization, allowing scientists to investigate neighborhoods of cells, local signaling, and tissue structure.
The result is a biological map in which molecular information can be interpreted in its original spatial context.

From thousands of cells to biological networks.
The value of single-cell data is not simply the number of cells measured. The deeper goal is to connect molecular patterns with biological relationships.
SYSTEM
Computational genomics can connect gene-expression patterns, cell populations, pathways, regulatory programs, and biological states into a more integrated representation of the system being studied.
Can we track how cells change?
Cells are not always fixed identities. Development, differentiation, activation, disease, and environmental responses can move cells through changing molecular states.
Origin
Initial cellular state
Transition
Changing molecular program
Decision
Emerging cellular state
Specialization
Functional identity
New State
Distinct biological program
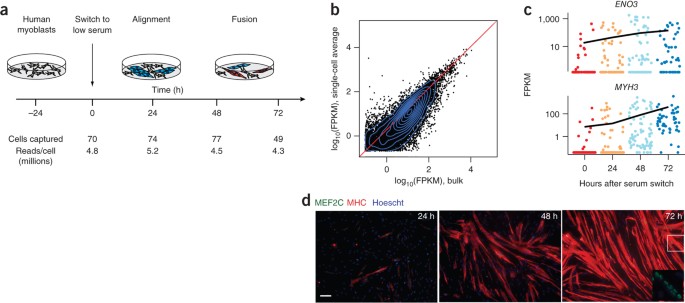
From cellular maps to biological discovery.
Single-cell genomics is becoming more than a sequencing technique. It is part of a broader scientific framework connecting molecular measurements, spatial organization, computation, and biological interpretation.
Cells
Expression
States
Context
Discovery
The future of biology may be mapped one cell at a time.
As single-cell sequencing, spatial technologies, computational genomics, and multi-omics continue to converge, scientists can move from measuring biological averages toward understanding the diversity and dynamics hidden inside living systems.